The Math Tools
To open the Math Tools, press the Math icon in your toolbar and the math menu will open:
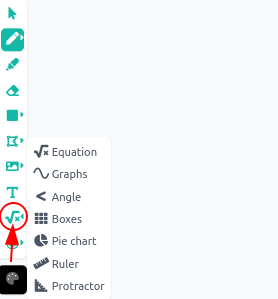
To open a math tool, press one of the buttons in the menu. Next, we'll go over the math tools one by one.
The Equation editor
The Equation editor lets you create beautiful equations really easily. You can start writing typeset math directly in the math field or switch to the LaTeX Code editor if you prefer to write LaTeX code:
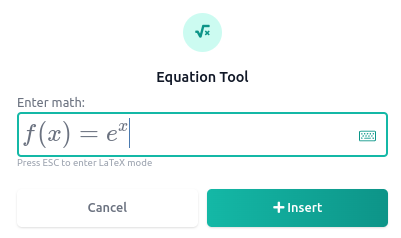
Click on the Virtual Keyboard button to open the math typing keyboard. This keyboard opens automatically on touch devices. More information about LaTeX code can be found in this support article.
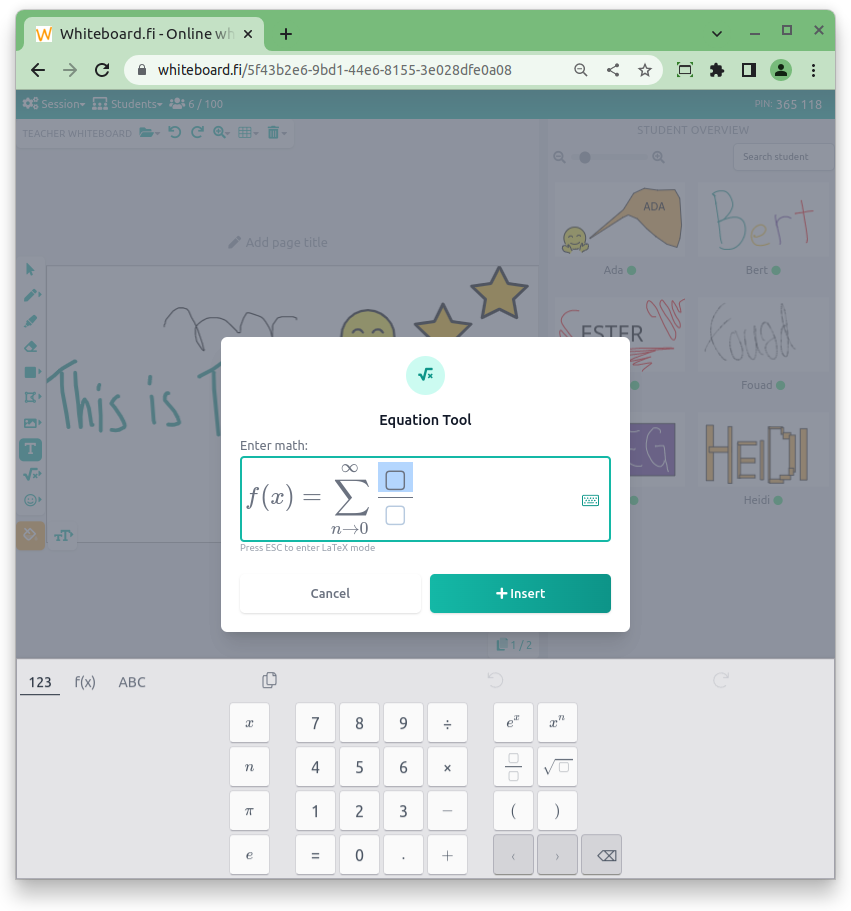
Press + Insert button to add to your whiteboard.
After inserting the equation, you can edit it by double clicking on it or by selecting it and clicking the equation button.
The Graph tool
The Graph tool lets you create graphs and select which part of the graph you want to display.
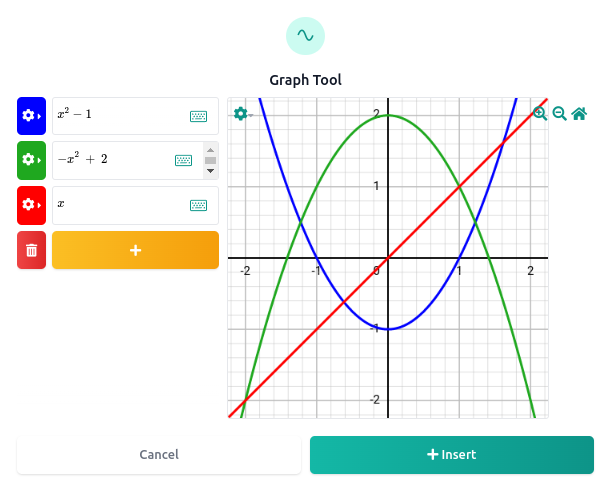
The input field works as the Equation editor described above. Click the + button to add multiple graphs (up to 12 graphs in the same coordinate system allowed).
Change colour and line width by clicking the coloured cog to the right of the equation field.
From the orange cog button you can choose different display settings.
Press + INSERT to add the image to your whiteboard. Before inserting, you can pan the graph to display the section you want.
Double click or press the math icon with graph selected to edit the graph.
The Angle tool
The angle tool lets you create angles of different size and look.
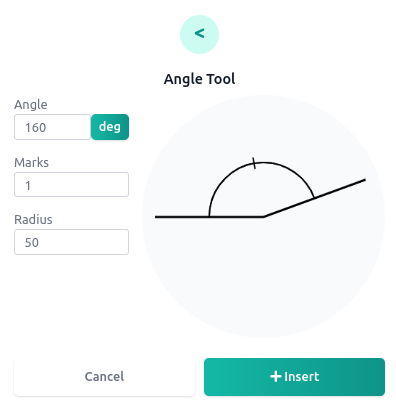
Enter an angle, either degrees or radians (click the button to toggle).
The lines adds ticks to the angle, letting you show that two angles are identical.
Radius is how far out the arc is displayed on the angle.
Press + INSERT to add to your whiteboard.
Double click or press the math icon with an angle selected to edit the angle.
The Boxes tool
The Boxes tool lets you create an array of boxes with a maximum size of 10 x 10 boxes.
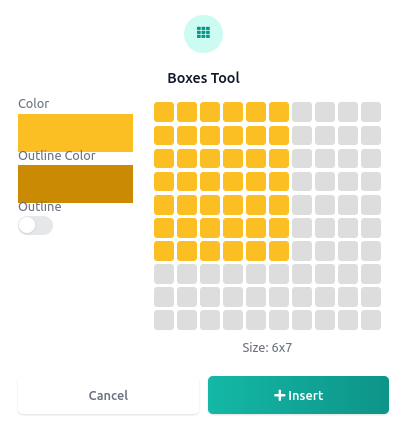
First, select a fill colour, outline colour and outline width...
Then press one of the buttons in the grid. Get a preview of the size by hovering over the buttons.
Double click or press the math icon with boxes selected to edit the boxes.
The Pie Chart tool
The Pie Chart tool lets you create Fractions in the form of Pie Charts.
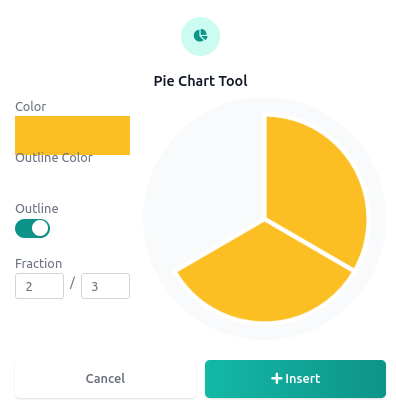
Select fill colour, outline colour and outline width.
Enter a divisor and a dividend below the Pie Chart image and the image will automatically update.
Press + INSERT to add to your whiteboard...
Double click or press the math icon with an angle selected to edit the angle.
The Rulers
Whiteboard.fi comes with a Ruler and a Protractor:
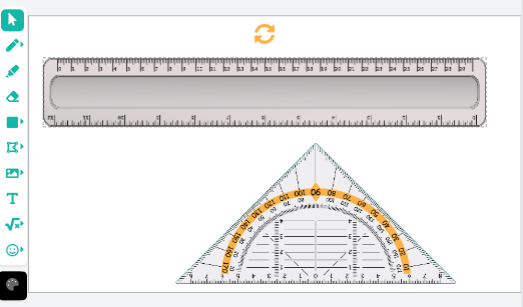
Since the ruler cannot be resized, it is possible for you and your students to measure objects on screen.
The protractor lets you and your students measure angles. Don't measure distances with the Protractor since it can be resized, measure distances with the Ruler. The protractor can be used in conjunction with the angle tool.